

01A missed warning
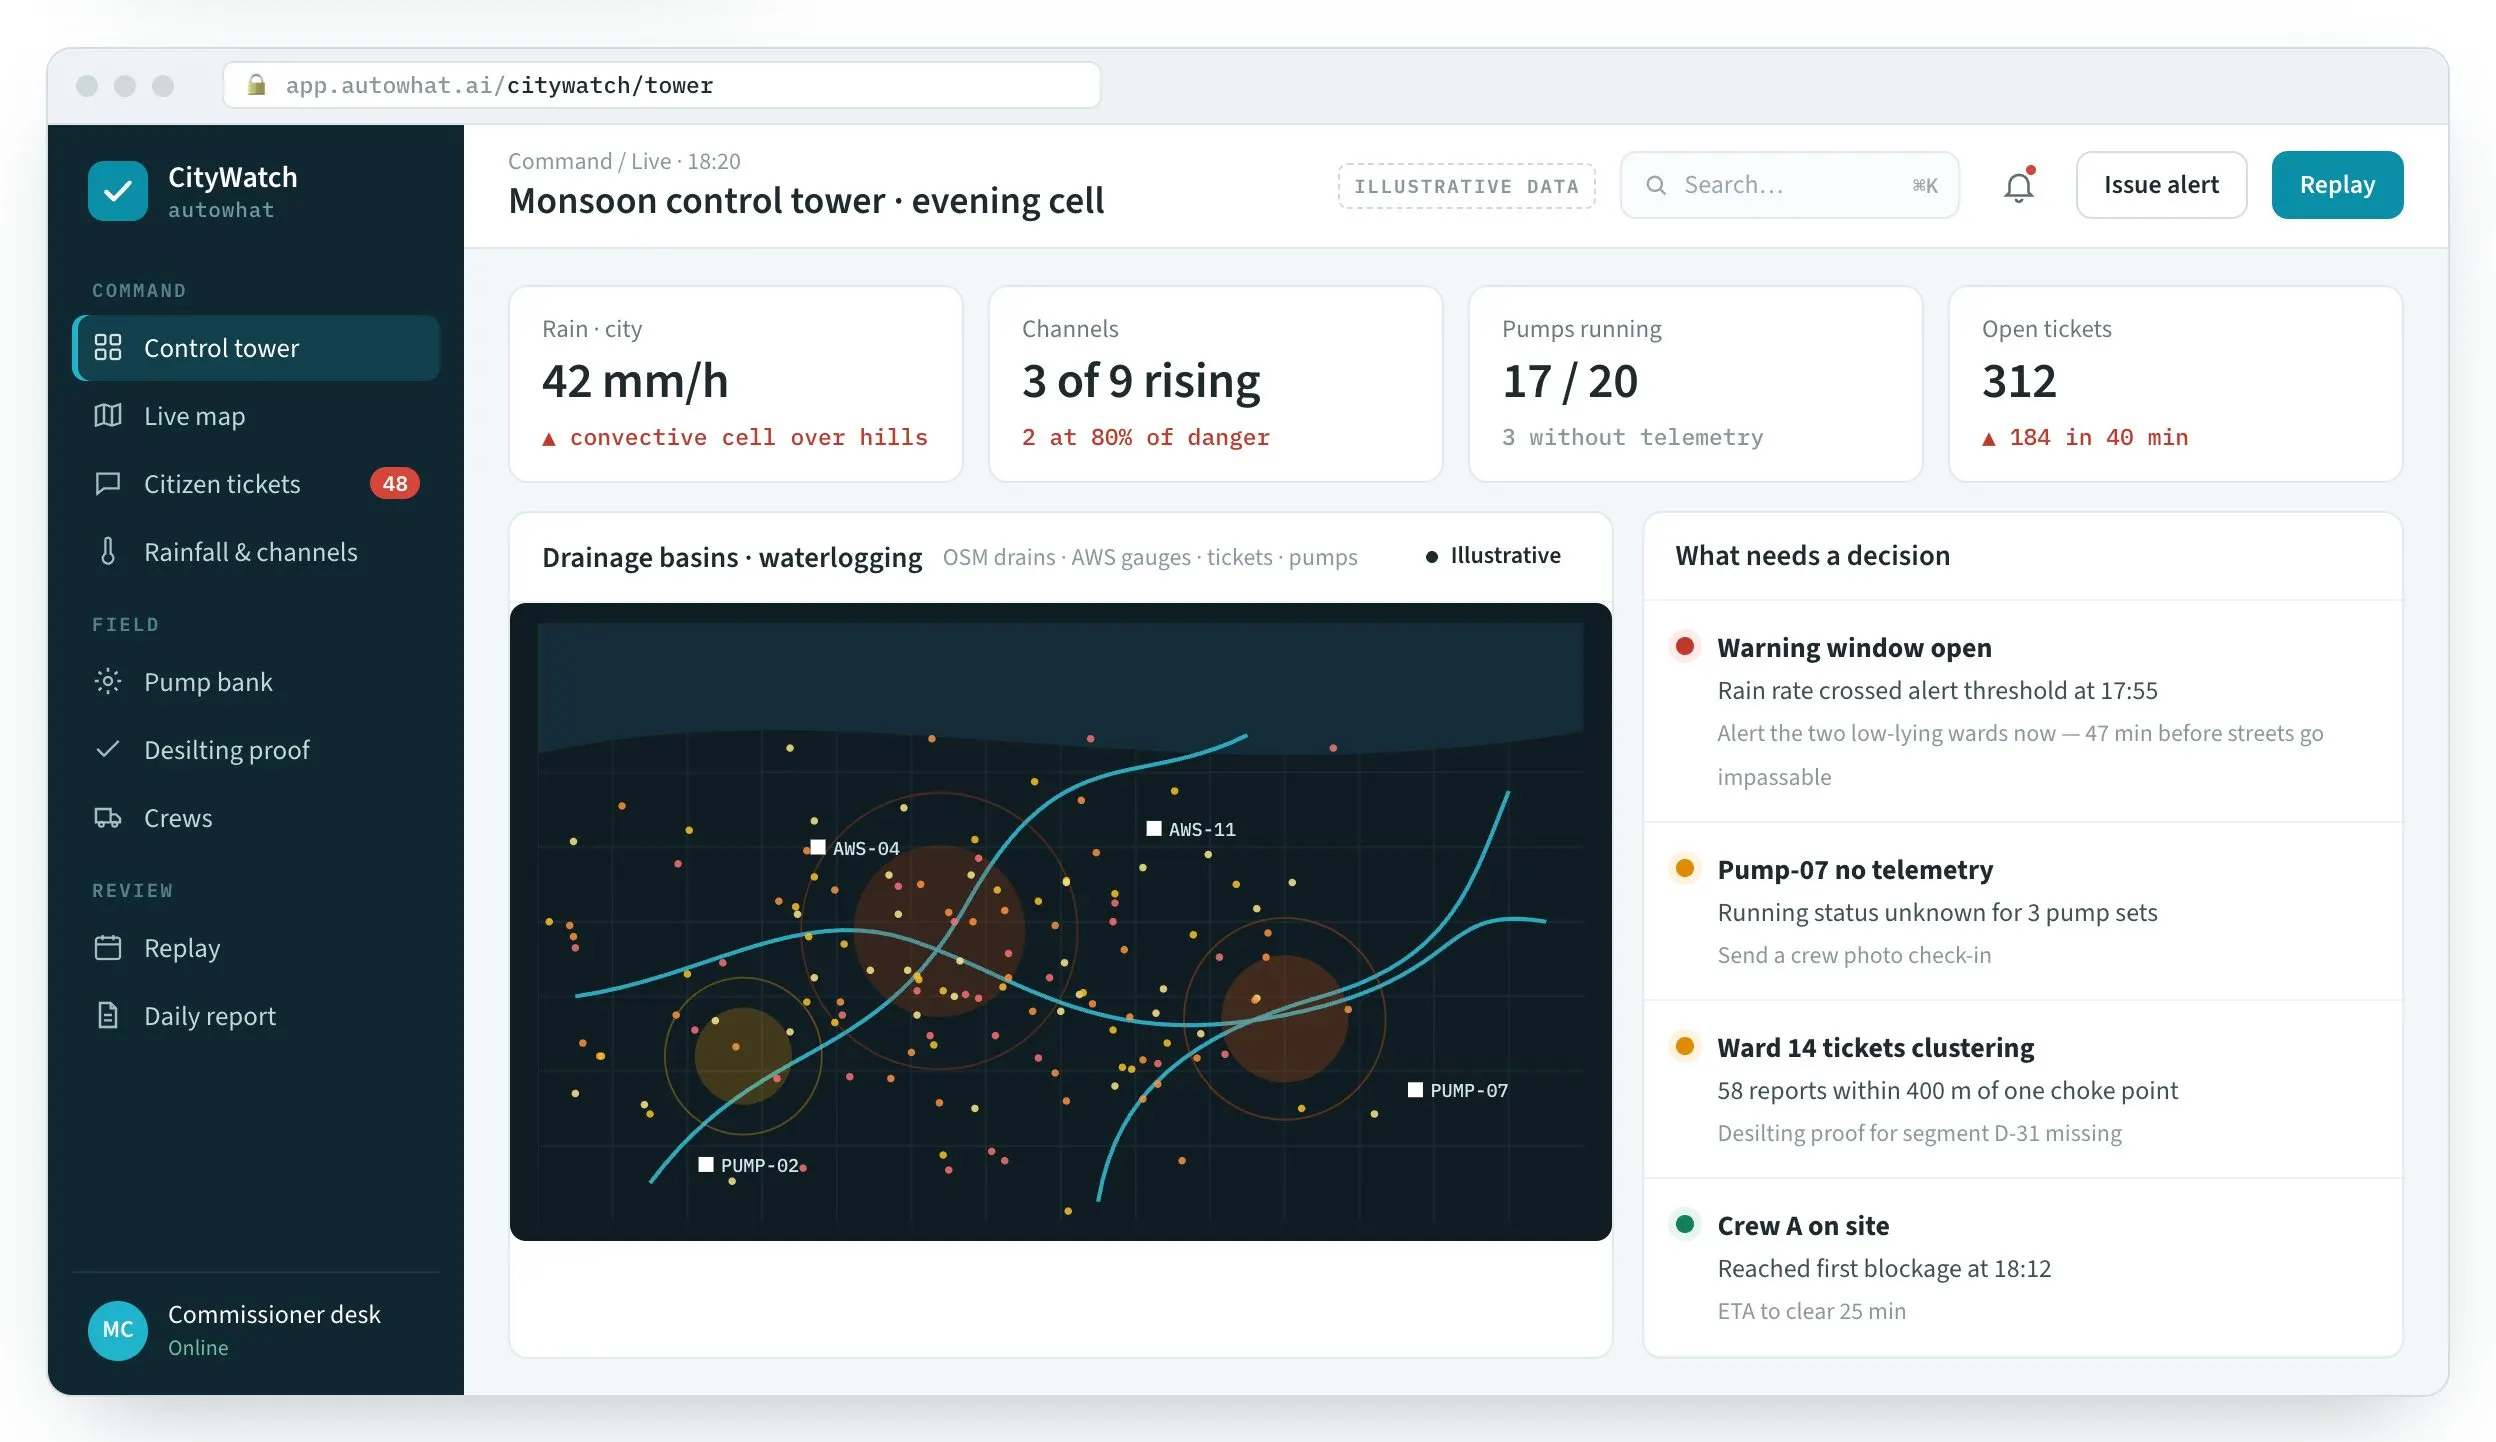
The alert is proposed while there is still time.
- Rain rate and channel trend crossing the threshold, with the wards at risk
- Pumps shown as running, offline or “no telemetry” — never assumed
Minutes of warning, used

OperationsCityWatch · monsoon & city operations control tower
For municipal commissioners and city engineers. Rain gauges, drain channels, pump sets, citizen complaints and crews on one live map — so the alert goes out while there is still time, every ticket has an owner, and every claim of work done comes with proof.
WhySound familiar?
From municipal commissioners, city engineers and ward officers. Composite quotes from discovery calls — the problems are real; the names are left out.

“The rain was on the gauges an hour before the street flooded.”
The signal existed; nobody was watching it against the channel levels, so the warning window passed unused.
Municipal commissionerWarnings that never go out
“Complaints come on paper and take days to reach anyone.”
Citizens call, write and post photos; by the time a ticket exists, the water has gone — and so has their trust.
Ward officerDays to acknowledge
“The register says the drain was cleaned. The water says otherwise.”
Desilting and pump runs are claimed, not proven, so every flood becomes an argument.
City engineerNo proof of work
HowWhat changes with CityWatch
Product screens with illustrative data. In a briefing we load your drains, wards and one past storm.
01A missed warning
Minutes of warning, used
02Paper complaints
Acknowledged in minutes

03Claims without proof
The review is a replay, not an argument

FieldCityWatch in the field
The workplace it runs in, the person who uses it on a phone, the team at the desk and the detail it reads.
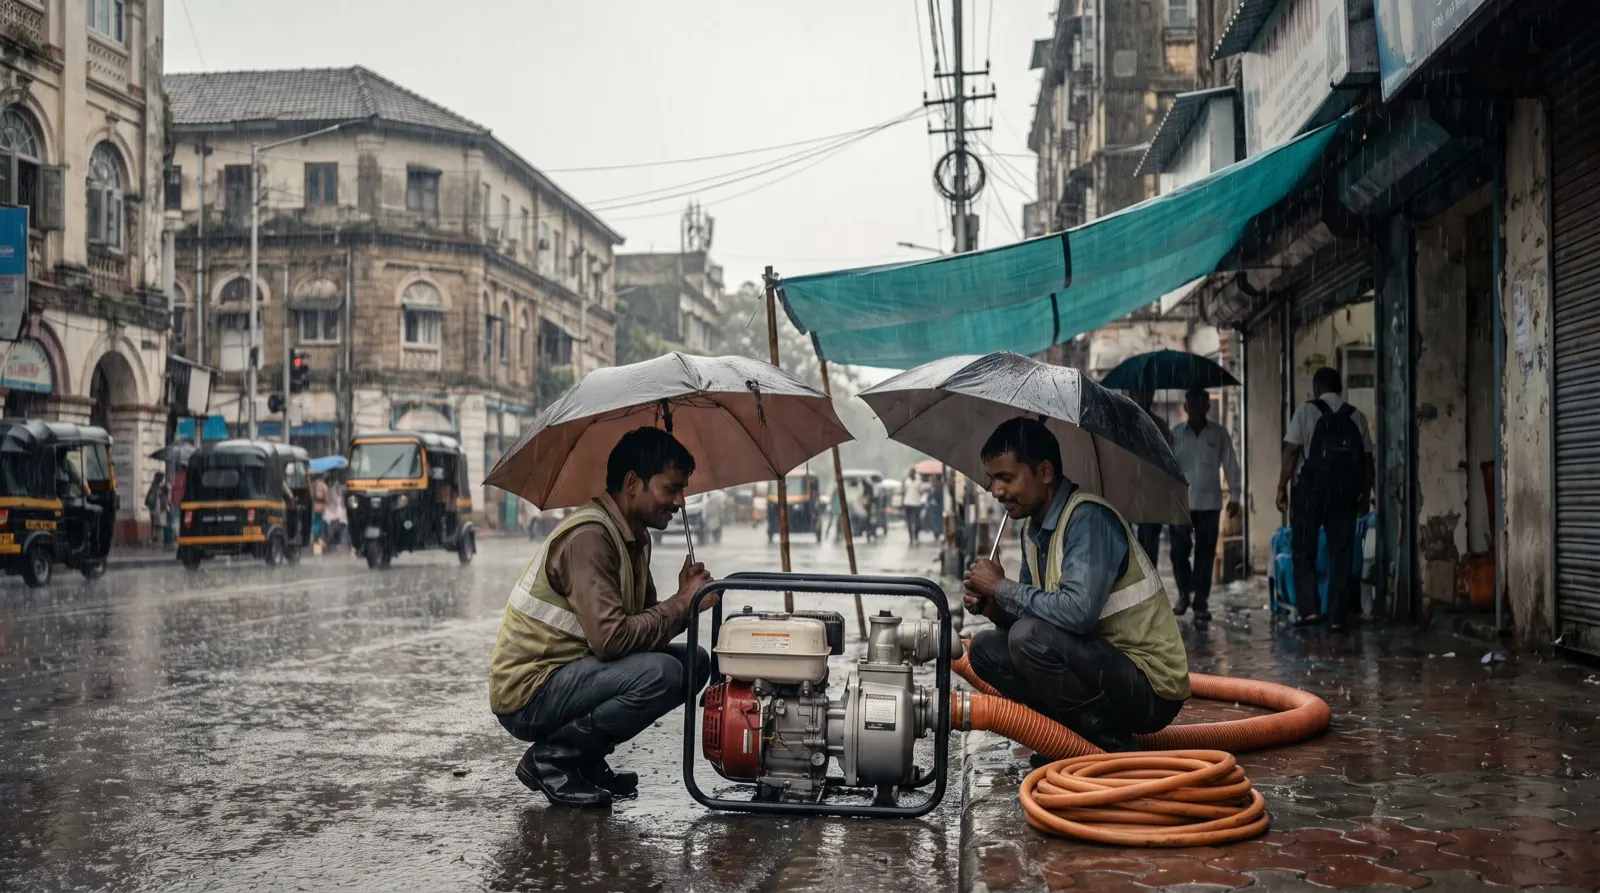
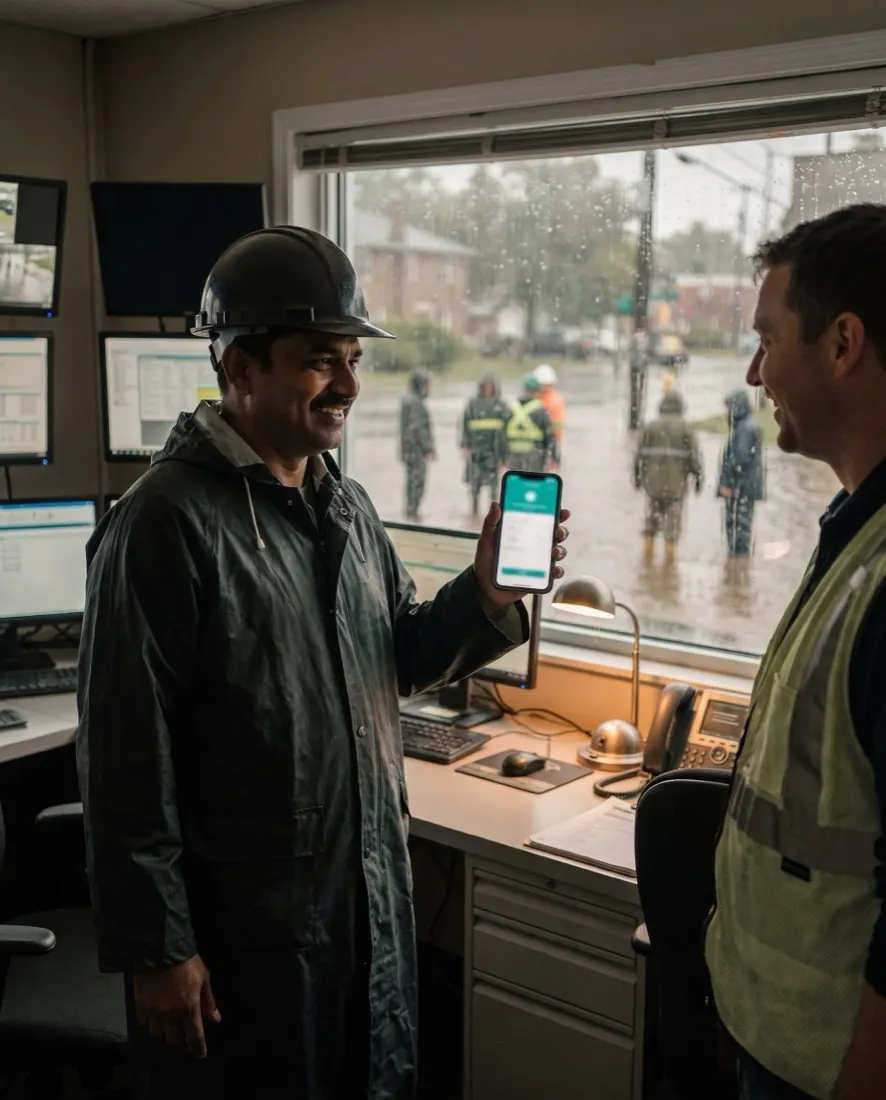
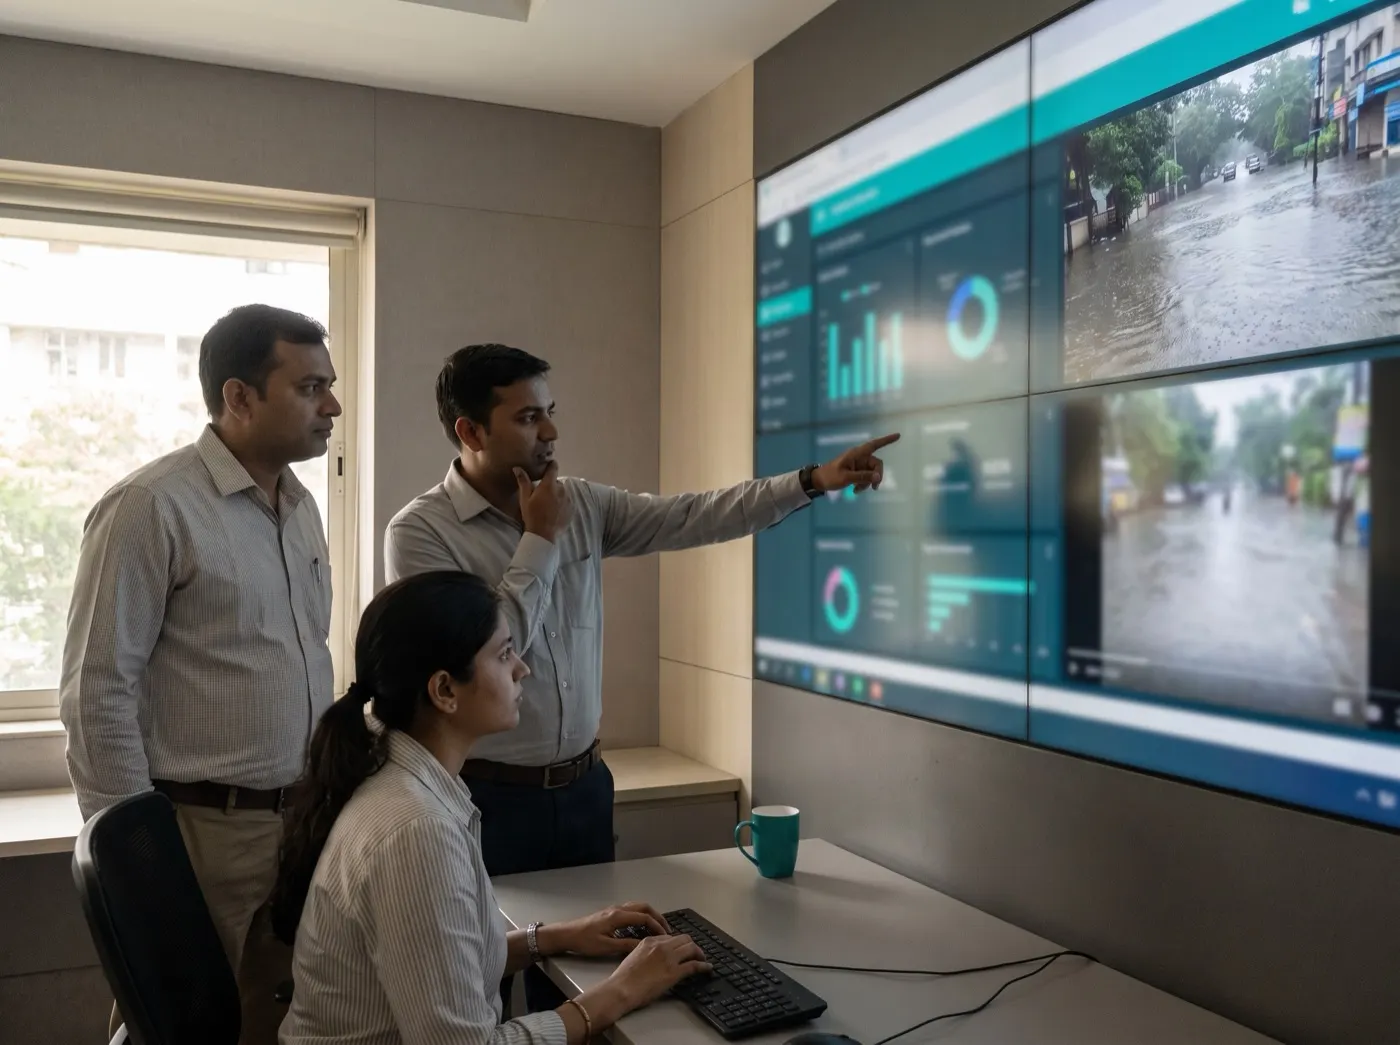
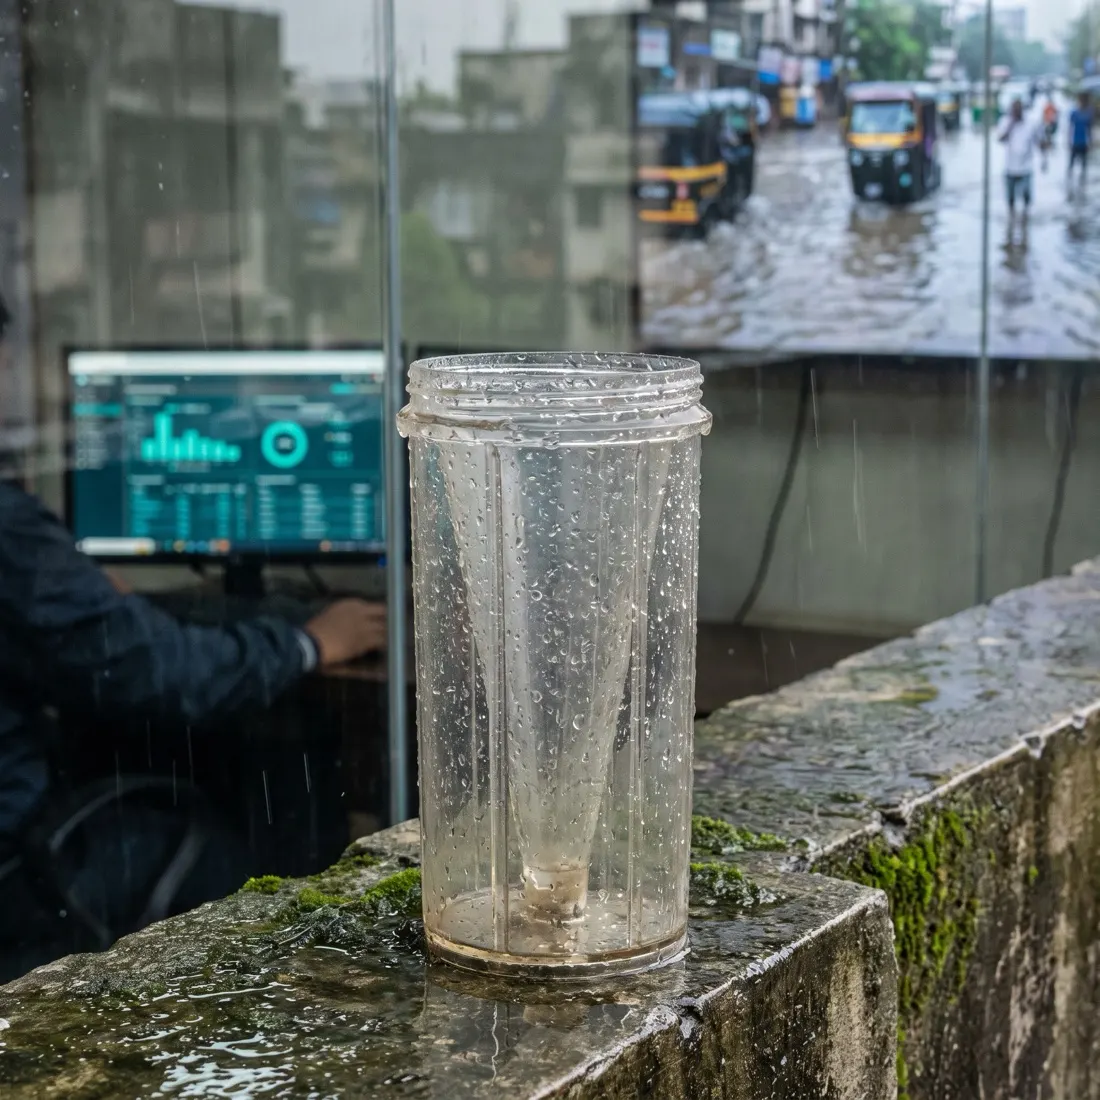
Photographs are illustrative — real customer sites are not shown.
01The screens
The live tower, the ward queue, the replay and the citizen desk on WhatsApp.
Rain, channels, pumps and citizen tickets on one map — and what needs a decision now.
Product screens with illustrative data — every name, place and figure is a placeholder.
02Before and after
Gauges, pumps, complaints and crews already report — to different people, at different times. The tower puts them on one clock.
| Area | Today | With CityWatch |
|---|---|---|
| Warning | Seen after streets flood | Alert when rain rate and channel trend cross the threshold |
| Complaints | Paper or phone · days to acknowledge | WhatsApp tickets, located and acknowledged in minutes |
| Pumps | Assumed running | Running, offline or “no telemetry” — never assumed |
| Desilting | Claimed in a register | Geotagged before/after photos per drain segment |
| Review | Reconstructed from memory | A replay and a report with every source linked |
03One clock
Every event carries a source, a timestamp and an owner — so the after-action review is a replay, not an argument.
Gauges · channels · pumps
Rain gauges, channel levels and pump telemetry stream in; silent sensors are flagged.
Citizen desk
Complaints on WhatsApp, the helpline and the web become located tickets.
Drainage basins
Tickets, rain and assets drawn on the drainage network and low-lying wards.
Alert rules
Rain rate plus channel trend crosses the threshold — the alert is proposed with the wards it covers.
Crews
Nearest crew with the right equipment assigned; ETA shared with citizens.
Proof-of-work
Before/after photos with GPS close the ticket and the drain segment.
After-action
The whole event replayed minute by minute, with who knew what, when.
Daily pack
The morning report and any court or audit annexure drafted from the record.
04The platform
Start with the monsoon; the same tower runs waste collection, roads and water supply.
05How we deliver
Built around the drains, pumps and wards you already have.
FAQQuestions we get about CityWatch
CityWatch is a city operations control tower for the monsoon and beyond. Short, factual answers for buyers, procurement and the assistants people ask first.
In short. CityWatch is a city operations control tower for the monsoon and beyond. It is built for municipal commissioners, city engineers and ward officers. It exists to remove the problems those teams describe in almost every first conversation: warnings that never go out while the gauges already show the rain; complaints on paper that take days to acknowledge; and desilting and pump runs claimed, never proven. With CityWatch, teams get alerts proposed when rain rate and channel trend cross the threshold, whatsApp tickets located to the drain segment, crews routed, closing photos, and every ward ranked; replay and an auto-drafted daily report. It connects to Rain gauges, Pump telemetry, WhatsApp desk and GIS drainage layers, is used by Commissioner · engineers · ward officers · citizens, and runs on web + whatsapp + field app. Like every Autowhat AI product, CityWatch goes live on one site, lane or process first, usually within weeks, on managed cloud, in your own VPC or on-premises, and shares one operational record with the other products, so the second deployment reuses the data and integrations of the first.
Municipal commissioners, city engineers and ward officers. A city operations control tower for the monsoon and beyond.
warnings that never go out while the gauges already show the rain; complaints on paper that take days to acknowledge; desilting and pump runs claimed, never proven.
alerts proposed when rain rate and channel trend cross the threshold; whatsApp tickets located to the drain segment, crews routed, closing photos; every ward ranked; replay and an auto-drafted daily report.
It connects to Rain gauges, Pump telemetry, WhatsApp desk, GIS drainage layers. Users: Commissioner · engineers · ward officers · citizens. Channel: Web + WhatsApp + field app.
With a 30-minute working session on your own data — an engineer from the relevant sector, not a sales queue. The first wave is scoped in that call; most products go live on one site, lane or process within weeks and then scale.
On managed cloud, in your own VPC (AWS, Azure or GCP) or on-premises, with your keys. SOC 2 Type II and ISO 27001 controls, India data residency when required, and local or open-weight models when policy demands it. The data stays yours.
06Briefing
A working session: your drains and wards mapped, one past event replayed, and the warning window you had measured.