

01Waiting for the lab
A phone photo, coached until it is good enough.
- Level, marker, focus and light checked before anything is analysed
- A bad photo is refused with a reason, in Hindi or English
A grade at the gate, in seconds (target)

EnterpriseGrainGrade · wheat quality from a photo
For farmers, commission agents, mandi labs, FPOs, flour mills and warehouses. Grain count, size in millimetres, defect percentages and the FCI FAQ grade — every number with an honest range, and a bad photo refused with coaching rather than analysed into a wrong answer.
WhySound familiar?
From mill buyers, mandi labs, FPOs and warehouse managers. Composite quotes from discovery calls — the problems are real; the names are left out.

“The truck waits while the sample goes to the lab.”
Manual grading takes a trained person, a sieve set and time — so trucks queue and decisions wait.
Mill procurement headHours per lot at the gate
“Two graders, two different answers.”
Counting broken and shrivelled grains by eye varies by person and by shift, and every disagreement becomes a price dispute.
Commission agentDisputes over every value cut
“We have no history of what each lot looked like.”
Results live on paper slips, so nobody can see whether a supplier or a stack is getting worse.
Warehouse managerNo trend, no evidence
HowWhat changes with GrainGrade
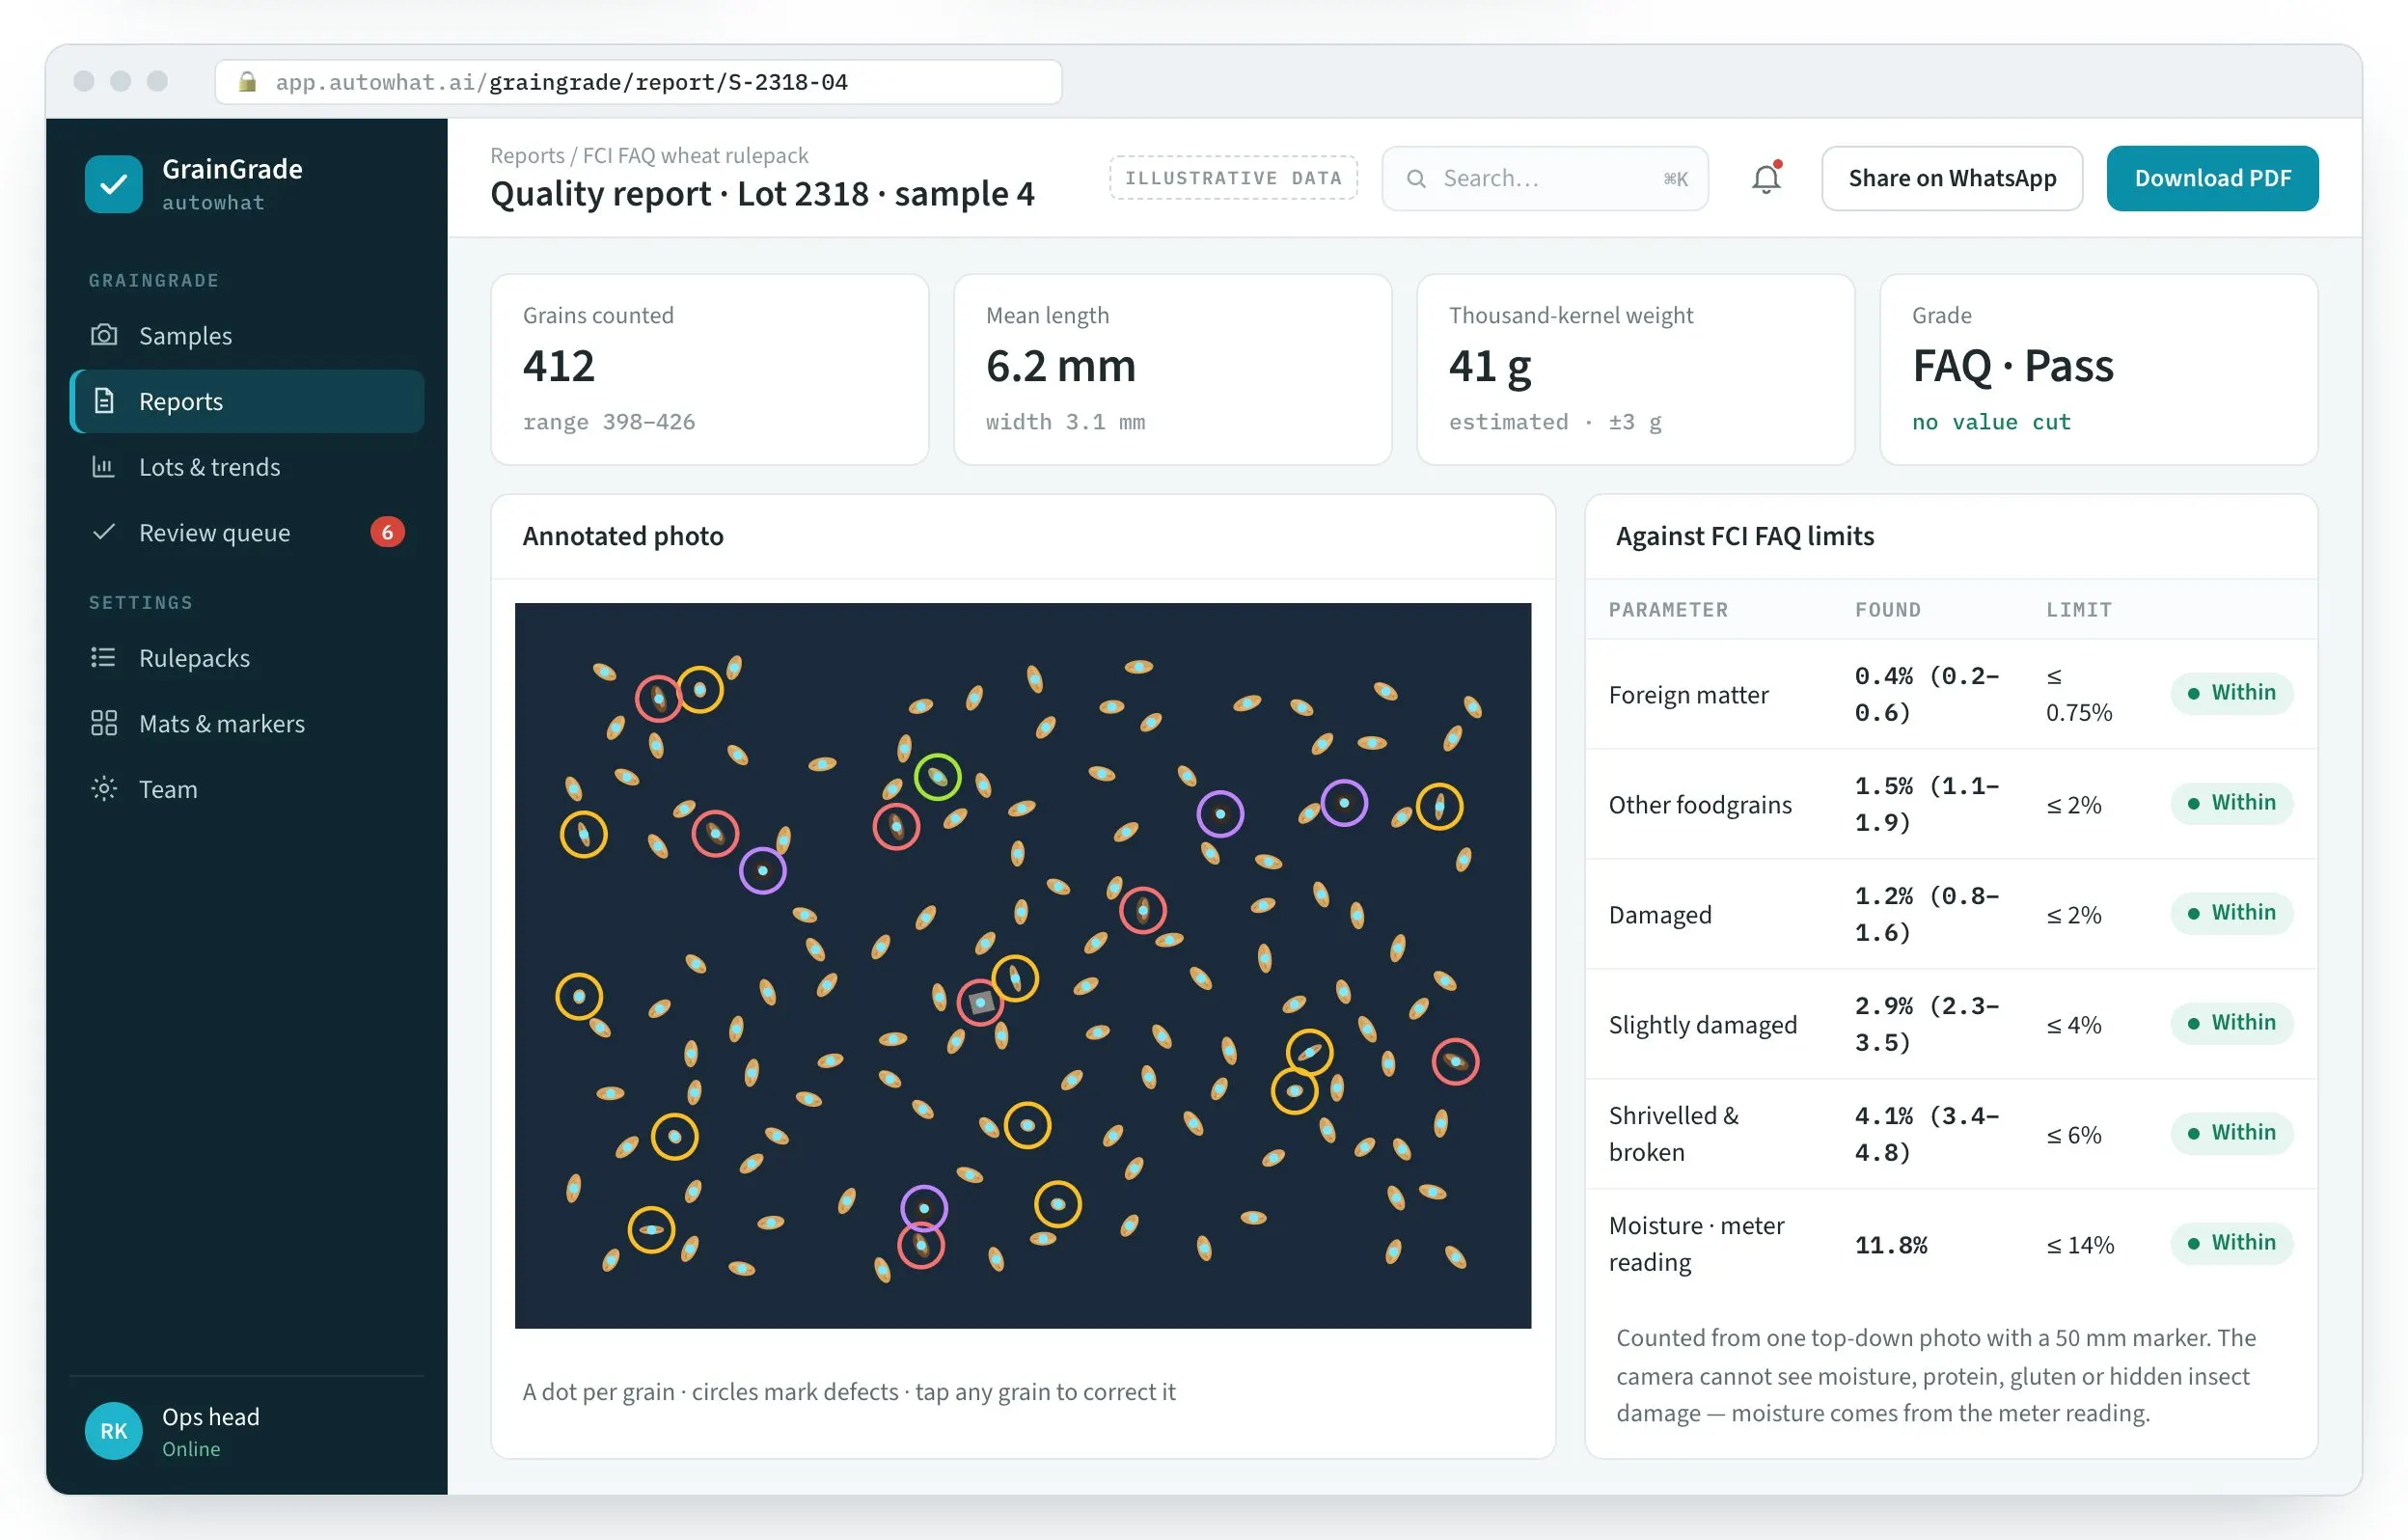
Product screens with illustrative data — GrainGrade is in development, with counting built and measured.
01Waiting for the lab
A grade at the gate, in seconds (target)
02Grading by eye
One answer both sides can see

03No history
Quality you can trace over time

FieldGrainGrade in the field
The workplace it runs in, the person who uses it on a phone, the team at the desk and the detail it reads.
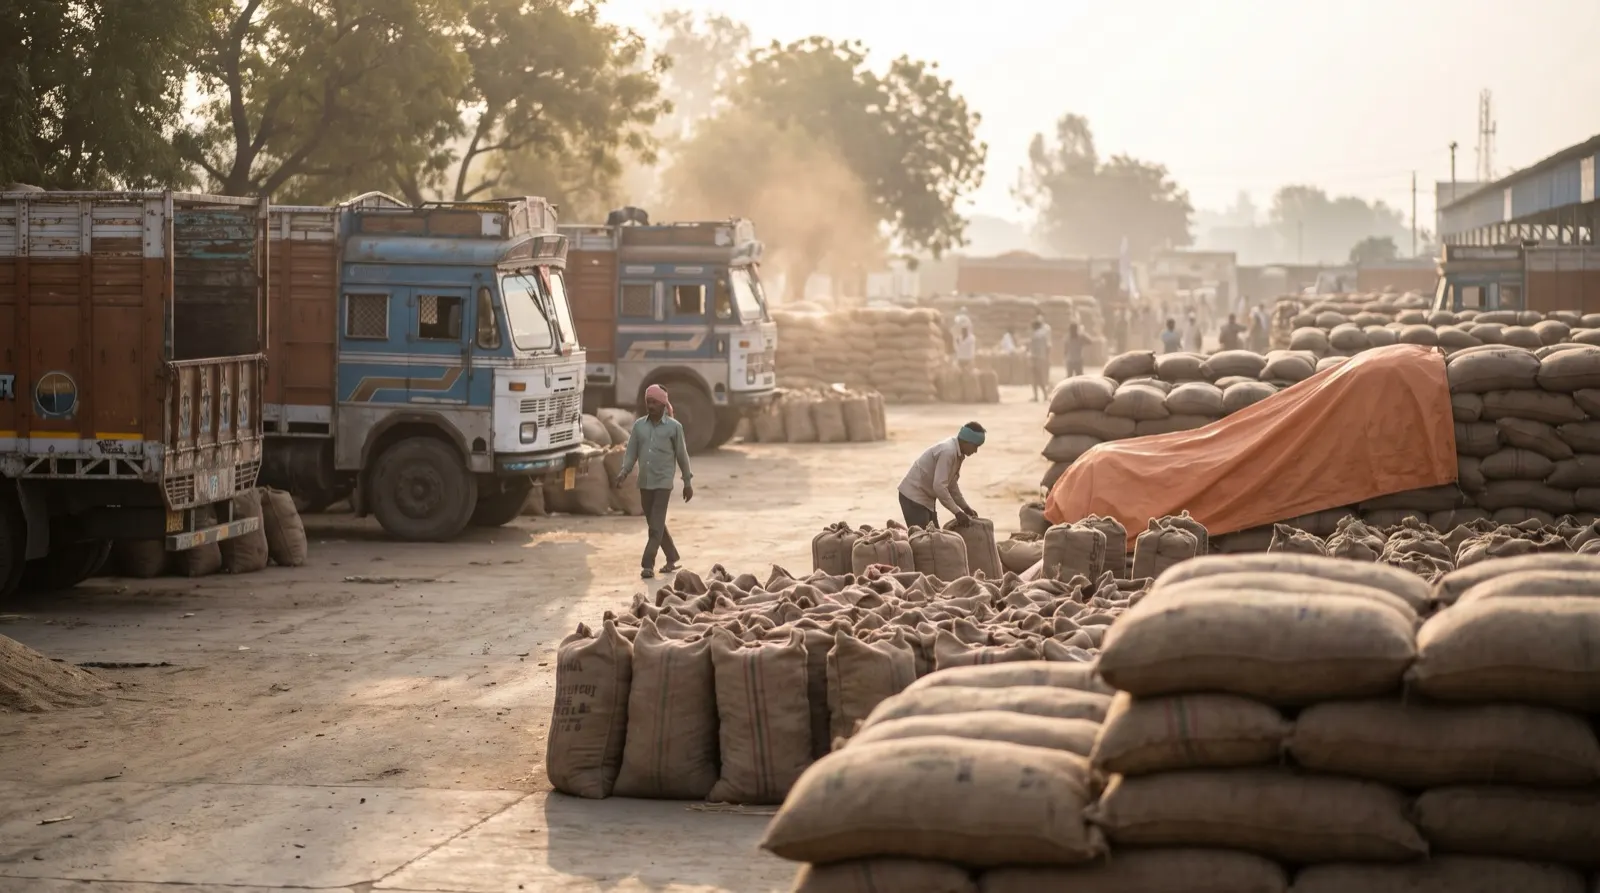
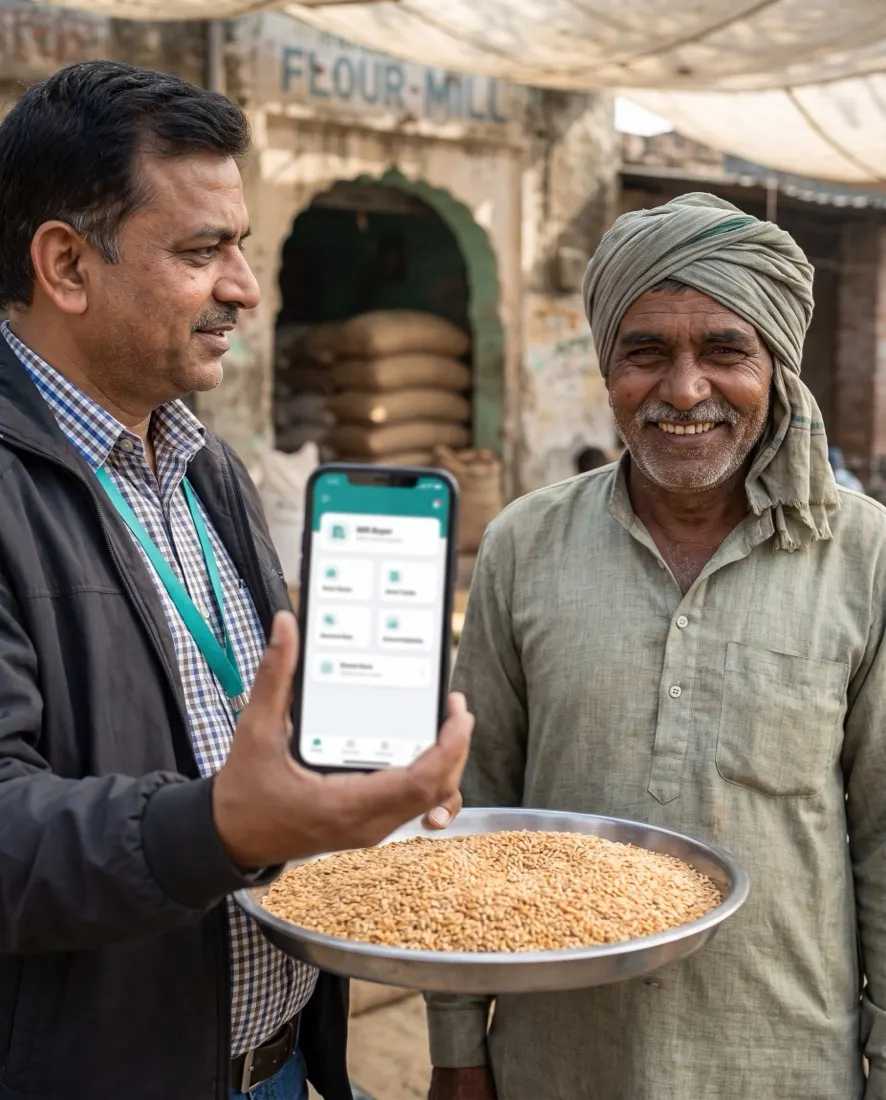
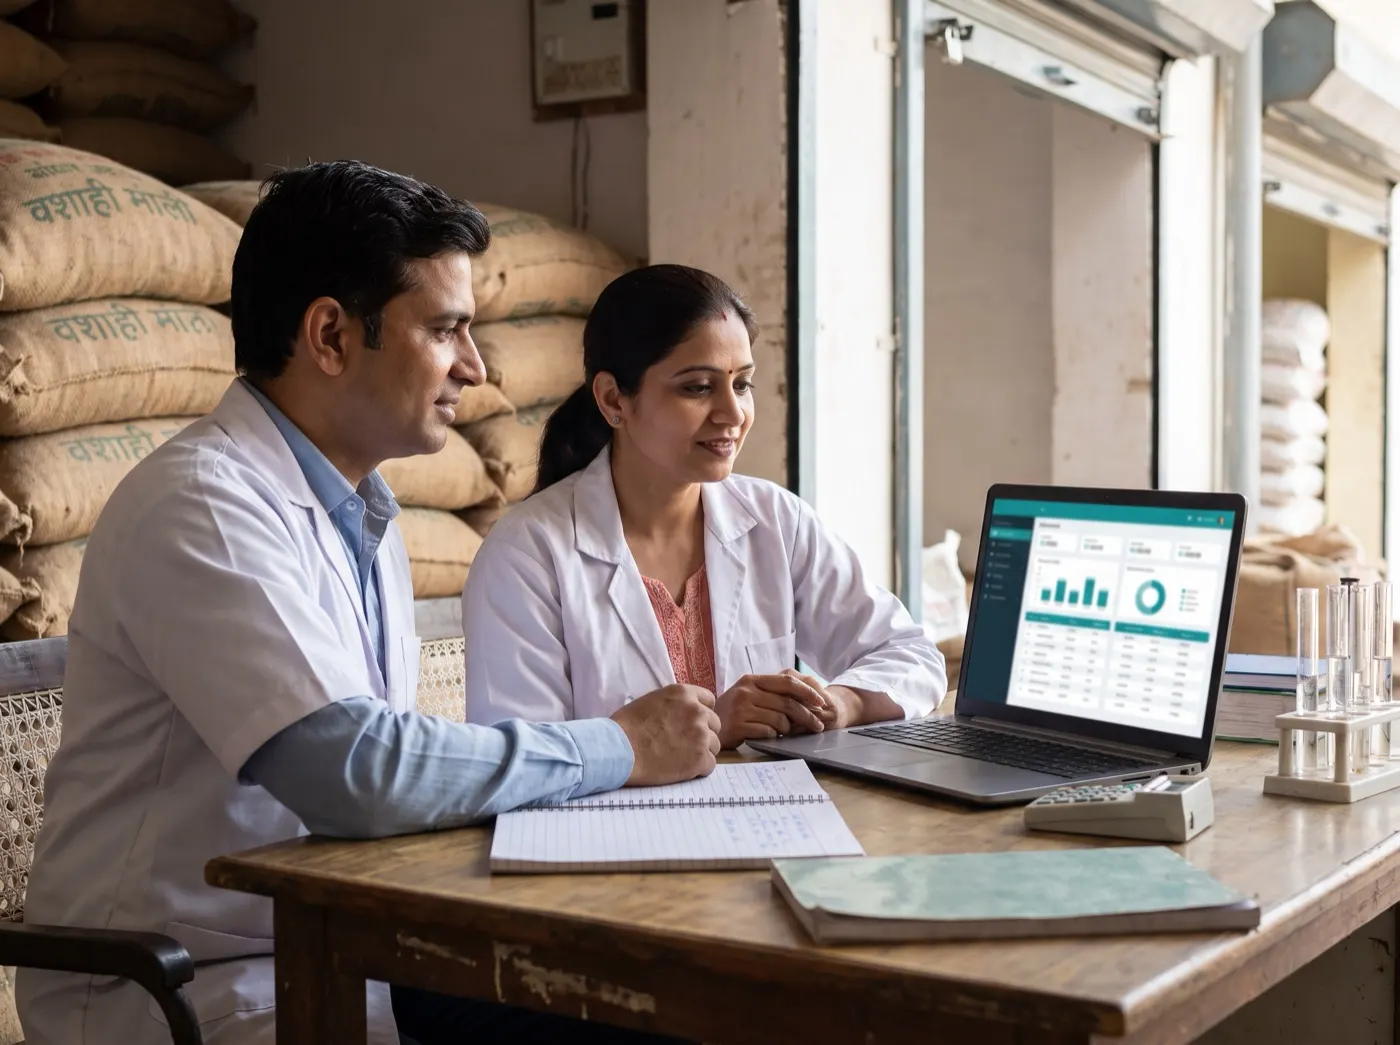
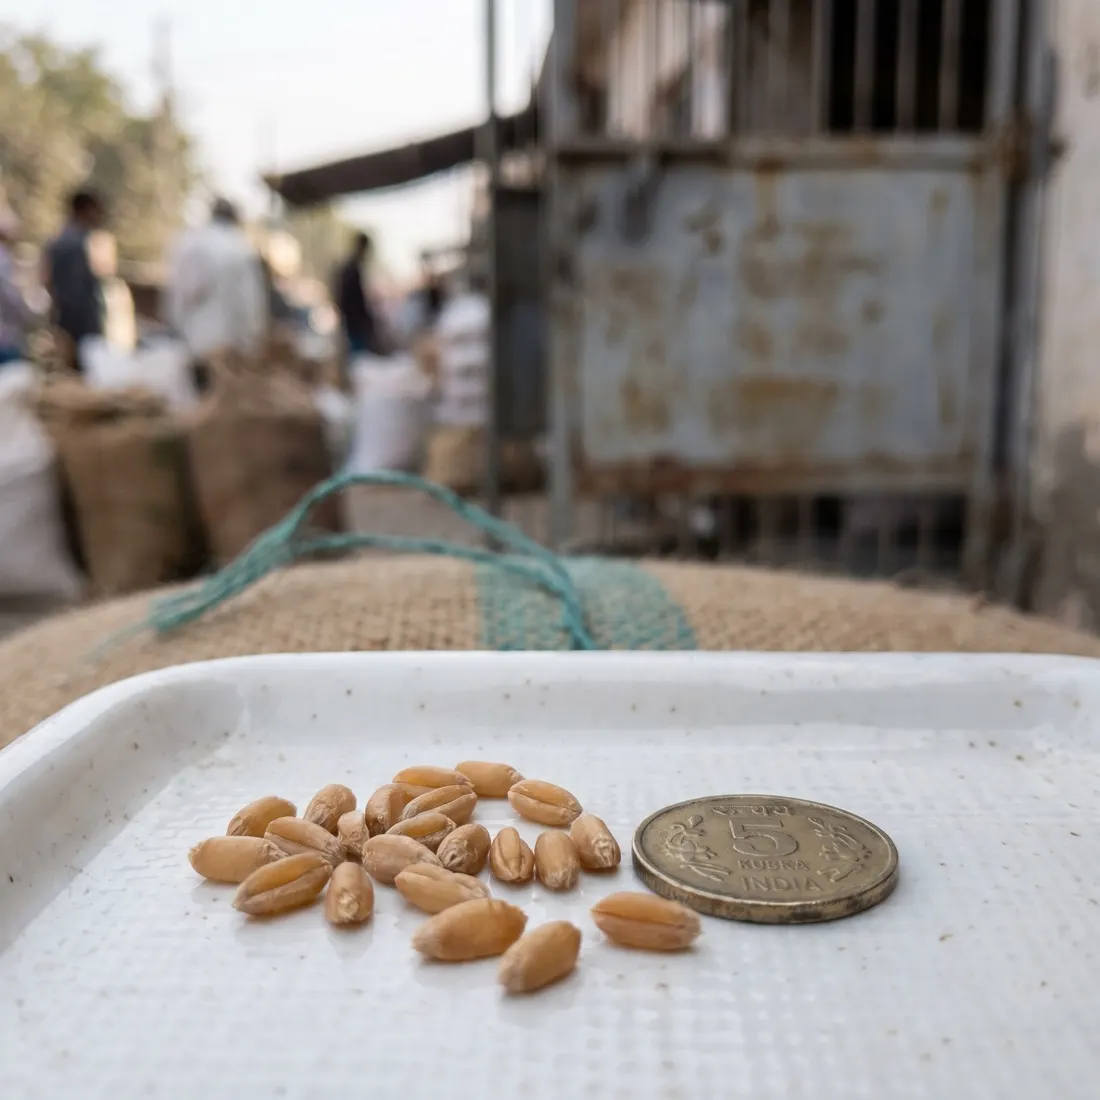
Photographs are illustrative — real customer sites are not shown.
GrainGrade is in development. Counting is built and measured; the other figures are design targets.
01The screens
The guided camera, the result on the phone, the shareable report and lot history.
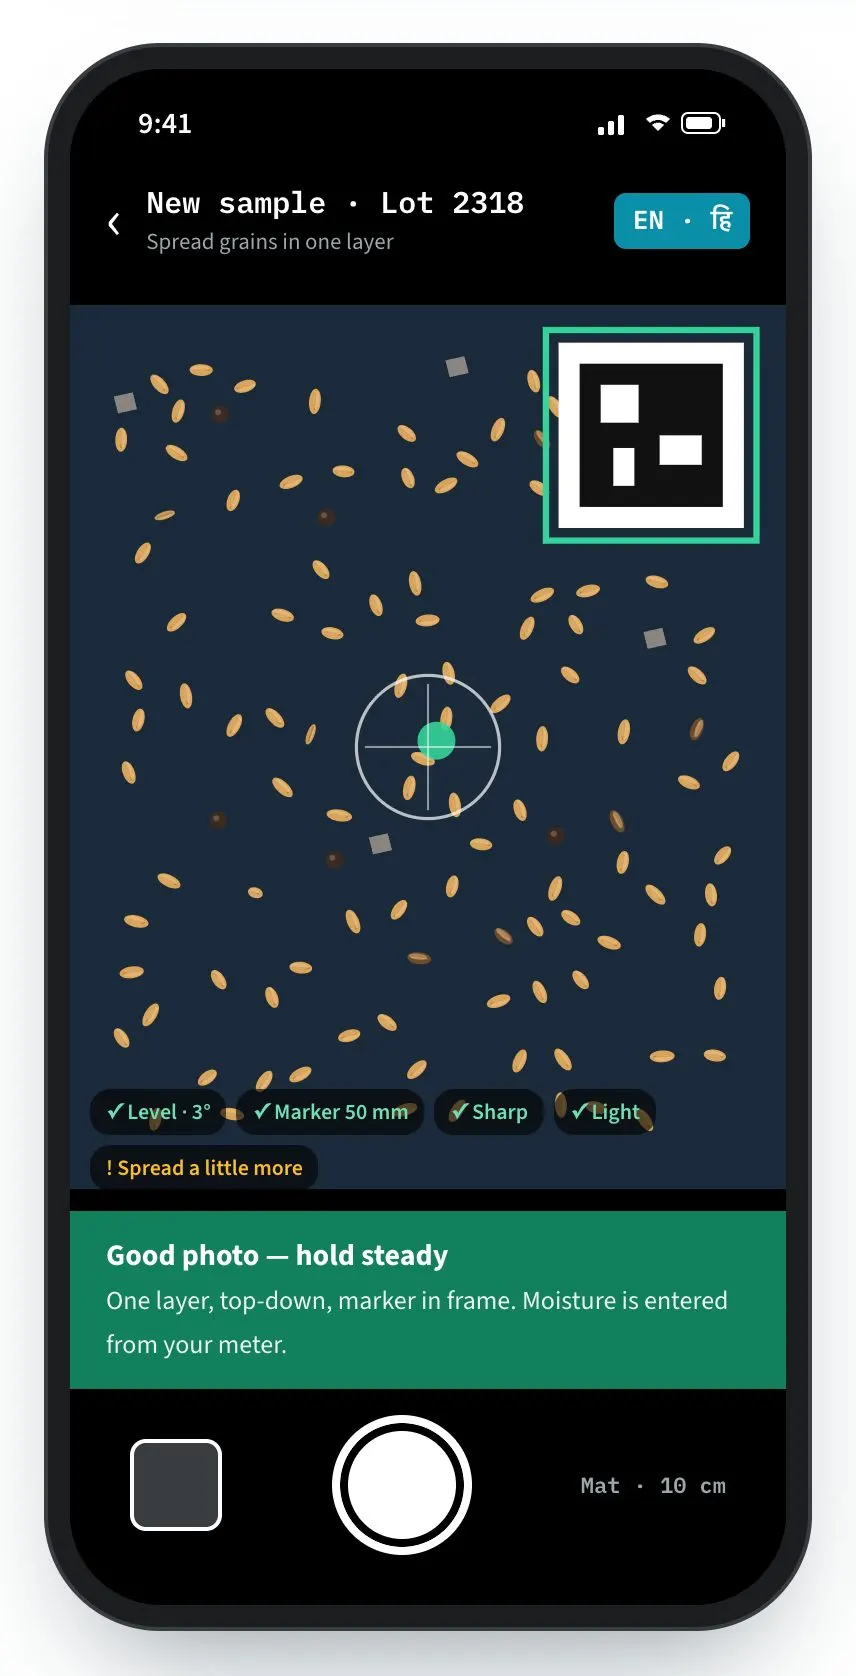
The camera coaches the photo — level, marker, focus and light — before anything is analysed.
Product screens with illustrative data. The grain images inside them are drawn, not photographed.
02Real samples
Trays and plates, uneven light, chaff, mustard and chana mixed in, heaps and scattered grain — the pipeline is designed and tested against samples like these.
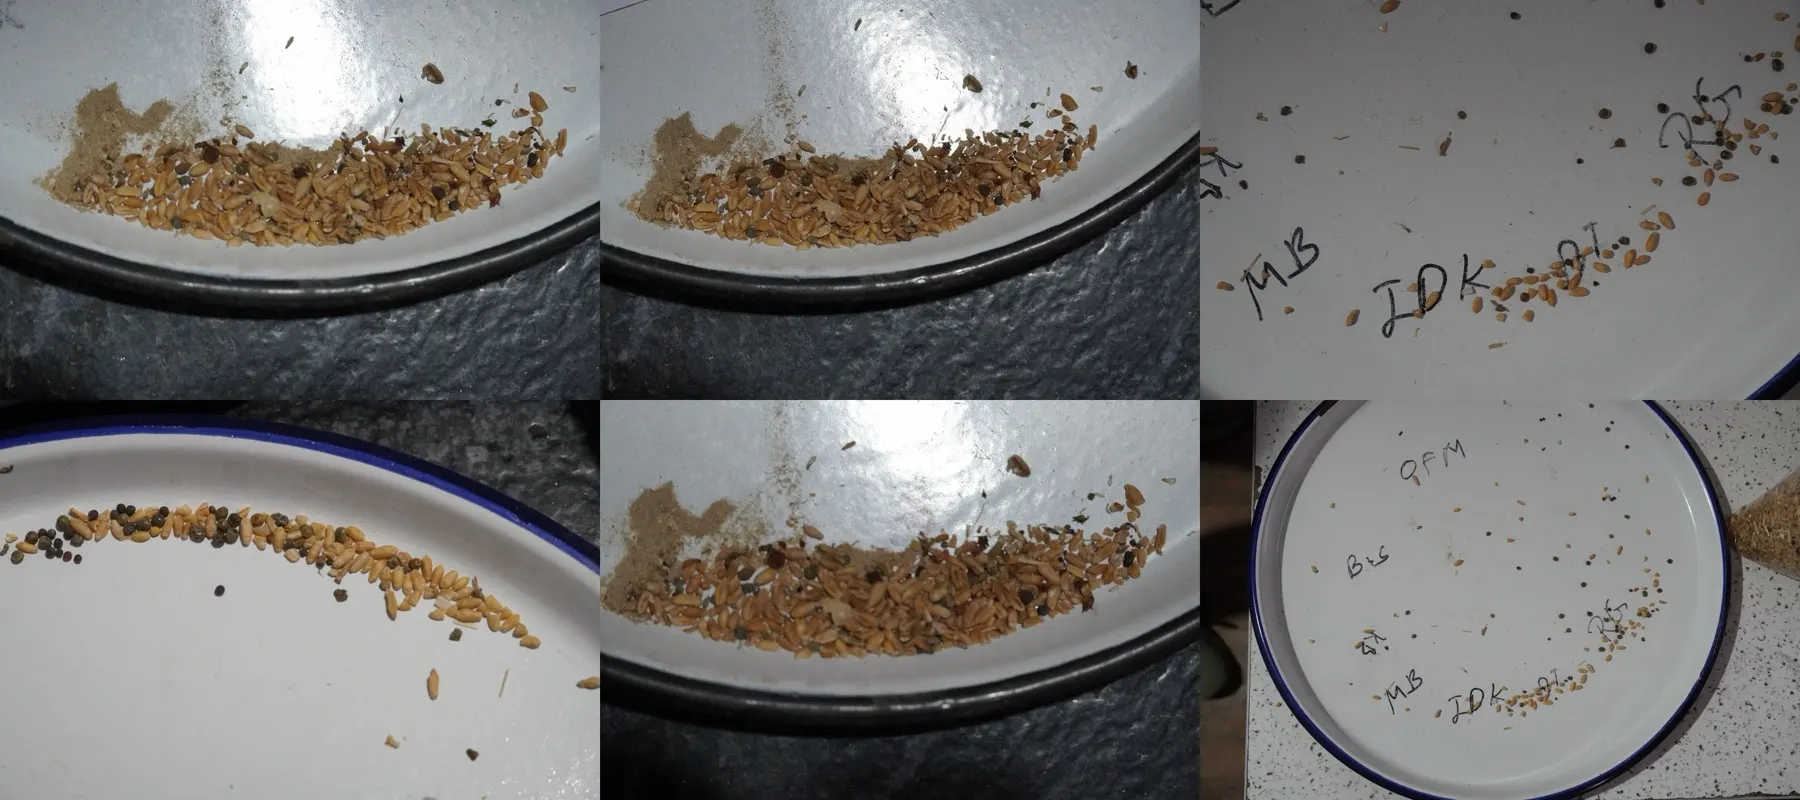
03The capture protocol
The camera coaches the shot instead of accepting anything. Six checks run before a single grain is counted.
04The vision pipeline
Pure, repeatable functions: every analysis stores the exact settings and version used, so any result can be re-derived.
Rectify
The marker turns any angle into a true top-down view with even mm per pixel.
Segment
Wheat is separated from the tray by colour, not brightness — so reflections don’t leak in.
Watershed
Each grain’s lit ridge becomes a seed; the dark crease between two grains keeps them apart.
Count + range
Three independent estimates; the published count comes with a range, flagged if they disagree.
Features
Length, width, shape, colour and local darkness for every grain, in mm.
Rules, then models
Broken, shrivelled, damaged, immature, other grains, foreign matter, insect bore-holes.
Rulepack
Defect percentages checked against FCI FAQ limits — or a mill’s or exporter’s own spec.
PDF · WhatsApp
A shareable report; tap any grain to correct it, and corrections train the next model.
05Defects & grading
Grading rules are data, not code — FCI FAQ first, then a mill’s intake spec or an exporter’s contract on the same schema.
| FCI FAQ wheat | Limit |
|---|---|
| Foreign matter | ≤ 0.75% |
| Other foodgrains | ≤ 2% |
| Damaged | ≤ 2% |
| Slightly damaged | ≤ 4% |
| Shrivelled & broken | ≤ 6% |
| Moisture (meter) | ≤ 14% |
What the camera cannot see: moisture, protein, gluten, aroma or insects hidden inside a grain. Moisture is entered from a meter reading — FCI grading needs it — and every report says so plainly.
06Where it stands
Each phase ships only when it meets its measured acceptance bar on a hand-counted test set.
FAQQuestions we get about GrainGrade
GrainGrade is a phone photo becomes a grain count, millimetre sizes, defect percentages and the FCI FAQ grade — with honest ranges — the same result whoever takes the photo, saved to the lot with trends by source. Short, factual answers for buyers, procurement and the assistants people ask first.
In short. GrainGrade is a phone photo becomes a grain count, millimetre sizes, defect percentages and the FCI FAQ grade — with honest ranges — the same result whoever takes the photo, saved to the lot with trends by source. It is built for mill buyers, mandi labs, FPOs and warehouse managers. It exists to remove the problems those teams describe in almost every first conversation: hours per lot at the gate while trucks queue; and value cuts disputed because counts vary by person. With GrainGrade, teams get capture coached until level, marker, focus and light are right, and every grain counted and measured; defects against FCI FAQ limits. It connects to Phone camera, Vision models, FCI FAQ limits and Lot ledger, is used by Buyers · labs · gate staff, and runs on mobile + web. Like every Autowhat AI product, GrainGrade goes live on one site, lane or process first, usually within weeks, on managed cloud, in your own VPC or on-premises, and shares one operational record with the other products, so the second deployment reuses the data and integrations of the first.
Mill buyers, mandi labs, FPOs and warehouse managers. A phone photo becomes a grain count, millimetre sizes, defect percentages and the FCI FAQ grade — with honest ranges — the same result whoever takes the photo, saved to the lot with trends by source.
hours per lot at the gate while trucks queue; value cuts disputed because counts vary by person; results on paper slips, with no trend.
capture coached until level, marker, focus and light are right; every grain counted and measured; defects against FCI FAQ limits; every sample saved to its lot — mandi, FPO, stack, gate.
It connects to Phone camera, Vision models, FCI FAQ limits, Lot ledger. Users: Buyers · labs · gate staff. Channel: Mobile + web.
With a 30-minute working session on your own data — an engineer from the relevant sector, not a sales queue. The first wave is scoped in that call; most products go live on one site, lane or process within weeks and then scale.
On managed cloud, in your own VPC (AWS, Azure or GCP) or on-premises, with your keys. SOC 2 Type II and ISO 27001 controls, India data residency when required, and local or open-weight models when policy demands it. The data stays yours.
07Pilot
Mills, warehouses, FPOs and mandi labs: send samples and your current lab results, and we’ll compare them side by side.