

The kickoff deck had thirty slides and a map of India covered in glowing lanes. Every plant, every RDC, every carrier, live from day one. By the second steering review the map was still glowing, but the plant heads had stopped opening it. Half the trucks had no pings, the OTIF tile disagreed with the sales report, and the Pune RDC was back to phoning dispatch.
Our view is simple: implement a control tower in the order your data becomes trustworthy, not the order the screens look impressive. For a supply chain control tower for Indian manufacturers, that order is definitions first, then the gate, then the road, then the depots. Each step should earn the next.
Implementation starts with ten written definitions, not a screen
The first deliverable of a control tower project is a document, not a dashboard. Write down what OTIF, placement SLA, gate TAT, load factor and damage rate mean, with one formula and one target each. If transport says OTIF is 96 and sales says 81, the tower will simply display the argument in brighter colours.
This step feels slow because it involves meetings, not software. It is also the cheapest step to get right and the most expensive to fix later. Our logistics KPI dictionary for manufacturers is a reasonable starting draft: ten numbers, each defined once and computed the same way for the company, the 3PL and the carrier.
Two rules help. Agree how a late trip gets an owner, so every delay is attributed to shipper, customer or carrier with a reason. And agree what counts as a ping, because visibility targets mean nothing until everyone uses the same test.
The first live module belongs at the gate, where data is richest
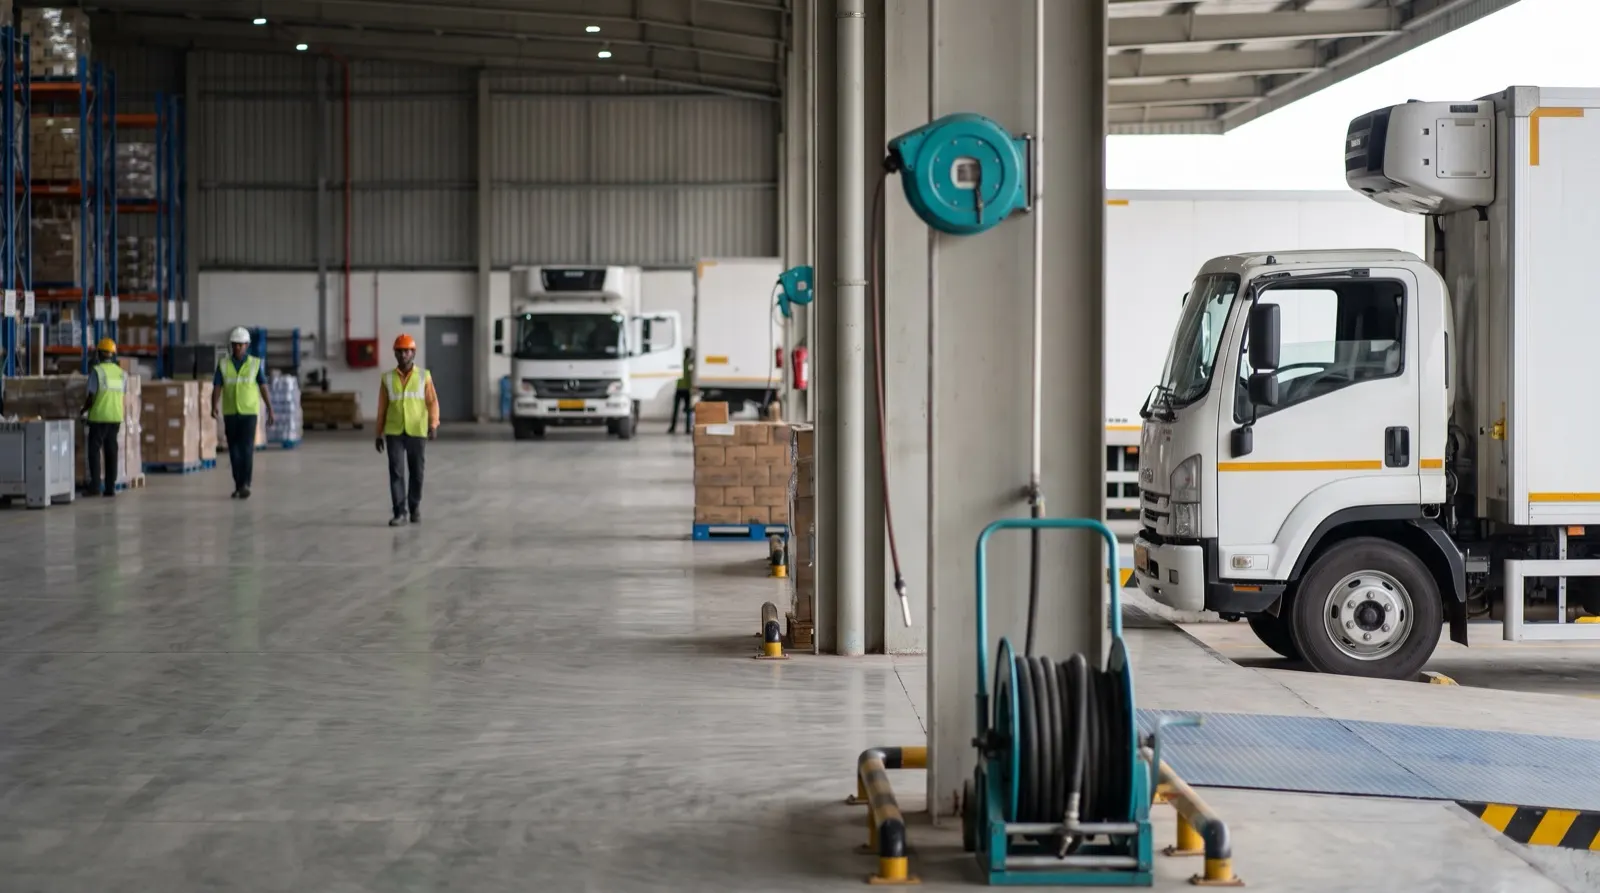
The gate is the one place in an outbound network the manufacturer fully controls. Every truck passes through it, and a supervisor is already standing there. That makes it the natural first module: stamp each hop on a handheld, from outside the gate to gate-out, and the gaps between stamps become dwell by plant, shift and hour.
The rollout for SCM for Manufacturers is phased the same way. It starts with the owned fleet and the gate, then adds the control tower and ETA model, then optimisation and carrier scorecards, and only then the digital twin. Our guide on measuring plant truck turnaround time covers the eight gate stages in detail.
A gate module also builds trust. The plant team sees its own dock board and its own bottlenecks within the first phase. People who see a tool help their shift are far more patient with the harder modules that follow.
Pick the pilot plant by data, not by politics
Teams often pilot at the head office plant, or at the plant with the loudest problems. Both are poor reasons. The right pilot is the plant where the tower can show a true picture fastest. Here is an illustrative example with round numbers, not data from any customer.
Say a manufacturer is choosing between two plants. Plant A dispatches 80 trucks a day and its supervisor already stamps 72 of them on a register. Plant B dispatches 50 trucks a day and stamps 20.
| Plant A | Plant B | |
|---|---|---|
| Trucks per day | 80 | 50 |
| Trucks with gate stamps | 72 | 20 |
| Stamp coverage | 72 ÷ 80 = 90% | 20 ÷ 50 = 40% |
| Late trips last month | 40 | 40 |
| Late trips with an owner and reason | 30 | 10 |
| Attribution coverage | 30 ÷ 40 = 75% | 10 ÷ 40 = 25% |
Plant B may have the worse problem, but Plant A will produce a believable tower first. Its numbers can be checked against what people already know, so the first review is about decisions rather than data quality. Plant B comes next, with a working template and a team that has seen the result.
A control tower is only as good as the dullest stamp at the gate. Get that right and the glowing map takes care of itself.
Hired carriers should not have to change how they work
In India, finished goods leave the plant on hired carriers' trucks as well as the owned fleet, and each carrier keeps its own spreadsheet. A rollout that asks every transporter to install a new device or fill a new template will stall at the second carrier. The better approach reads what already exists: SIM location with consent, FASTag toll reads, GPS trackers, carrier APIs and manual updates, all five treated as ping sources.
Carrier MIS files should arrive in whatever template the carrier uses, be staged first, and wait for a person when they conflict with what is already recorded. That review step is unglamorous, but a bad file that goes live unreviewed can undo months of trust in an afternoon. Our note on ingesting carrier MIS files into the control tower describes the staging approach.
The ERP dispatch sheet deserves the same care. It seeds every trip, promise date and route distance, so it should be parsed and validated before anything is written. When a tower looks wrong, an unchecked dispatch sheet is the first place to look.
Access rules are an implementation decision, not a setting
A control tower brings company staff, 3PLs, carriers, RDCs and drivers onto one record. Decide early who sees what, and enforce it on the server rather than hiding columns in the screen. A carrier should only ever see its own trucks, and a carrier who suspects otherwise will stop sharing data.
Personal data needs a plan too. Driving licences and IDs belong in a separate vault, masked everywhere else, with an audit trail of who saw what and when. These choices are hard to retrofit once a hundred carriers have logins, so make them before the first carrier is invited.
The case for going live everywhere at once
The strongest objection comes from leaders who have watched pilots die. A single plant pilot, they argue, never gets the attention to scale. The network effects of a control tower, like comparing carriers across plants or moving short-dated stock between RDCs, only appear when everything is connected. A slow rollout risks becoming a permanent pilot.
We take this seriously, because permanent pilots are real. Our answer is to phase the rollout with a written plan from day one: which plant follows the pilot, what result triggers the move, and who signs it off. Phasing should change the order of work, not the ambition. What we would not do is switch on every plant before the definitions and the gate data are sound, because then the first network-wide view is a network-wide argument.
What to do this week
- Draft one written definition and target for OTIF, placement SLA and gate TAT, and get transport and sales to sign the same page.
- Count stamp coverage and attribution coverage at two candidate plants, using the arithmetic above.
- List every ping source your carriers already use, and every carrier MIS template you receive today.
- Write down which roles see which trucks, and where driver IDs will be held.
- Name the plant that follows the pilot and the result that triggers the move.
A good control tower implementation feels almost boring from the inside. One definition at a time, one gate at a time, until the RDC stops phoning because it already knows. More in the SCM for Manufacturers guides.